|
Best
|
Best
|
Best
|
Best
|
||||||||
|
Tan
|
Tan
|
Tan
|
Tan
|
Tan
|
|||||||

Sea
4°
|
Sea
2°
|
Sea
2°
|
Sea
8°
|
Sea
12°
|
Sea
18°
|
Sea
23°
Swim
|
Sea
24°
Swim
|
Sea
18°
|
Sea
16°
|
Sea
14°
|
Sea
11°
|
The weather in March is significantly warmer than the previous month and temperatures continue to rise at a fast pace into April. March has average maximum temperatures of 11°C (53°F) which is too cold for sunbathing. The sunshine percentage is 71% making it sunny and pleasant most of the time. The hours of sunshine per day are 8.5hrs making the days long and bright. It is not a good time for sunbathing in Ocean County.
March has total rainfall of 8.7cm (3.4inches) making it mostly dry with only light showers. There are just 8.8 days with some rainfall so you can still enjoy the beach on the majority of rain free clear days.
Sea temperatures are a cold 2°C (36°F). March is too cold for swimming in Ocean County for any length of time, unless you have a wetsuit.
Consider visiting Ocean County in the months of June, July, August, September, for the best beach weather. Also consider one of our other suggestions for March.
No, March is not a good time for sunbathing in Ocean County.
March has average maximum temperatures of 11°C (53°F) which is too cold for sunbathing. The sunshine percentage is 71% making it sunny and pleasant most of the time. The hours of sunshine per day are 8.5hrs making the days long and bright. March has total rainfall of 8.7cm (3.4inches) making it mostly dry with only light showers. There are just 8.8 days with some rainfall so you can still enjoy the beach on the majority of rain free clear days.
More about March temperature and sunshine.
No, March is too cold for swimming in Ocean County for any length of time, with the sea water at 2°C (36°F), unless you have a wetsuit.
More about March sea temperatures.
No, March is not a good time for a holiday in Ocean County.
March has average maximum temperatures of 11°C (53°F) which is too cold for sunbathing. The sunshine percentage is 71% making it sunny and pleasant most of the time. The hours of sunshine per day are 8.5hrs making the days long and bright. March has total rainfall of 8.7cm (3.4inches) making it mostly dry with only light showers. There are just 8.8 days with some rainfall so you can still enjoy the beach on the majority of rain free clear days. It is not a good time for sunbathing in Ocean County. Sea temperatures are a cold 2°C (36°F). March is too cold for swimming in Ocean County for any length of time, unless you have a wetsuit.
More about the March temperatures and sunshine.
No, Ocean County is too cold for sunbathing in March.
The average maximum temperature in Ocean County in March is 11°C (53°F). The average maximum temperature is 7°C (44°) in the previous month and 18°C (64°F) in the next month.
The average temperature in Ocean County in March is 5°C (42°F). The average temperature is 1°C (34°F) in the previous month and 11°C (52°F) in the next month.
More info about the March temperatures and sunshine.
The average day light hours per day in Ocean County in March are 11.9. The sunshine percentage is 71% making it sunny and pleasant most of the time. The hours of sunshine per day are 8.5hrs making the days long and bright.
More about March sunshine.
The weather in March is significantly warmer than the previous month and temperatures continue to rise at a fast pace into April. The average maximum temperature in Ocean County in March is 11°C (53°F). The average maximum temperature is 7°C (44°F) in the previous month and 18°C (64°F) in the next month.
The average temperature in Ocean County in March is 5°C (42°F). The average temperature is 1°C (34°F) in the previous month and 11°C (52°F) in the next month.
The average minimum temperature in Ocean County in March is -0°C (31°F). The minimum temperature is -5°C (24°F) in the previous month and 5°C (40°F) in the next month.
The days in March are much longer than the previous month and the days continue to get a bit longer into April. March has marginally more hours of sunshine than the previous month and hours of sunshine continue to rise into April. During March the average day light hours are 11.9 per day in Ocean County. The sunshine percentage is 71% making it sunny and pleasant most of the time. The hours of sunshine per day are 8.5hrs making the days long and bright.
The ultraviolet index in Ocean County in March is typically 5.1 during March. An ultraviolet index reading of 3 to 5 indicates there is a moderate risk of harm from unprotected sun exposure. Keep out of the sun during the strongest hours around midday when unprotected skin risks burning in less than 30 minutes. For the sensitive wear protective clothing, a wide-brimmed hat, and UV-blocking sunglasses. Generously apply broad spectrum SPF 30+ sunscreen every 2 hours, even on cloudy days, and after swimming or sweating. Tanning for hours is possible with the right application of sun cream. Watch out for relections from water that may increase ultraviolet exposure.
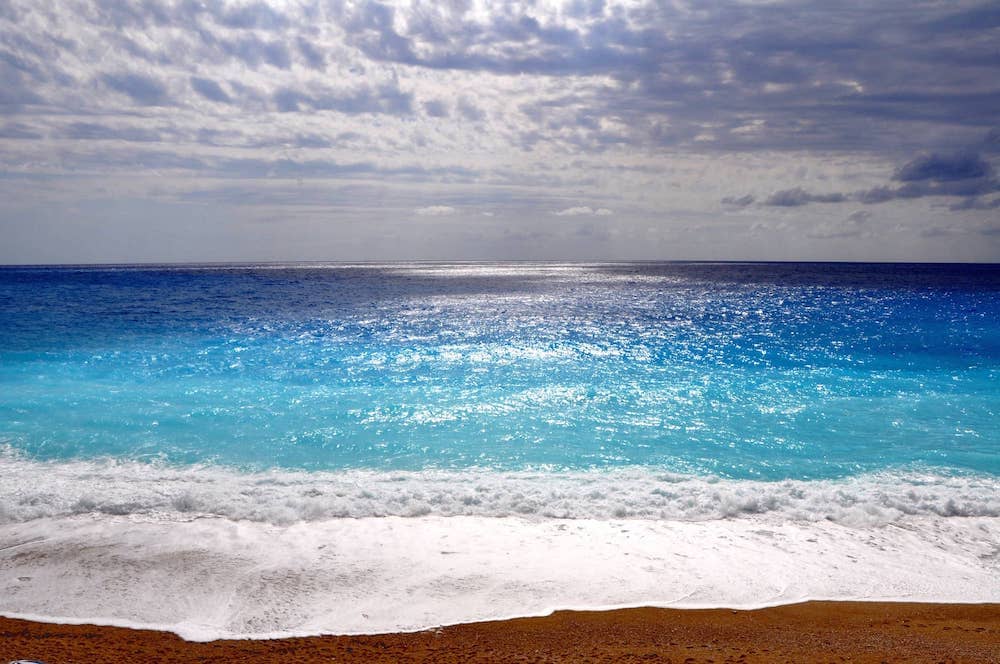
The average sea water temperature in Ocean County in March is 2.2°C (36.0°F) which is extremely cold and not suitable for swimming. Taking a dip at this temperature would risk hypothermia.
March weather is slightly wetter than the previous month. March has a few more days of rain than the previous month. The average total rainfall in Ocean County in March is 8.7cm (3.4inches) and on average there are 8.8 rainy days in March making it a quite rainy time to visit the beach.
The maximum dew point (an indicator of humidity) in Ocean County in March is 3°C (37°F) which is a bit dry for some. The dew point is -1°C (31°F) in the previous month and 8°C (8°F) in the next month.
The average maximum relative humidity in Ocean County in March is typically 86%. The maximum relative humidity is 86.8% in the previous month and 89.1% in the next month.
The average relative humidity in Ocean County in March is typically 64.3%. The average relative humidity is 65.5% in the previous month and 65.3% in the next month.
The average maximum wind speed in Ocean County in March is typically 26KM/H (16MPH). The average maximum wind speed is 27KM/H (17MPH) in the previous month and 26KM/H (16MPH) in the next month.
The average wind speed in Ocean County in March is typically 11KM/H (7MPH). The average wind speed is 11KM/H (7MPH) in the previous month and 10KM/H (6MPH) in the next month.
The average wind direction in Ocean County in March is from the North West.
Beaches recommended for you today, this weekend, in the next 2 weeks or in any month of the year.

Beaches recommended for you today, this weekend, in the next 2 weeks or in any month of the year.